InfoGraphics
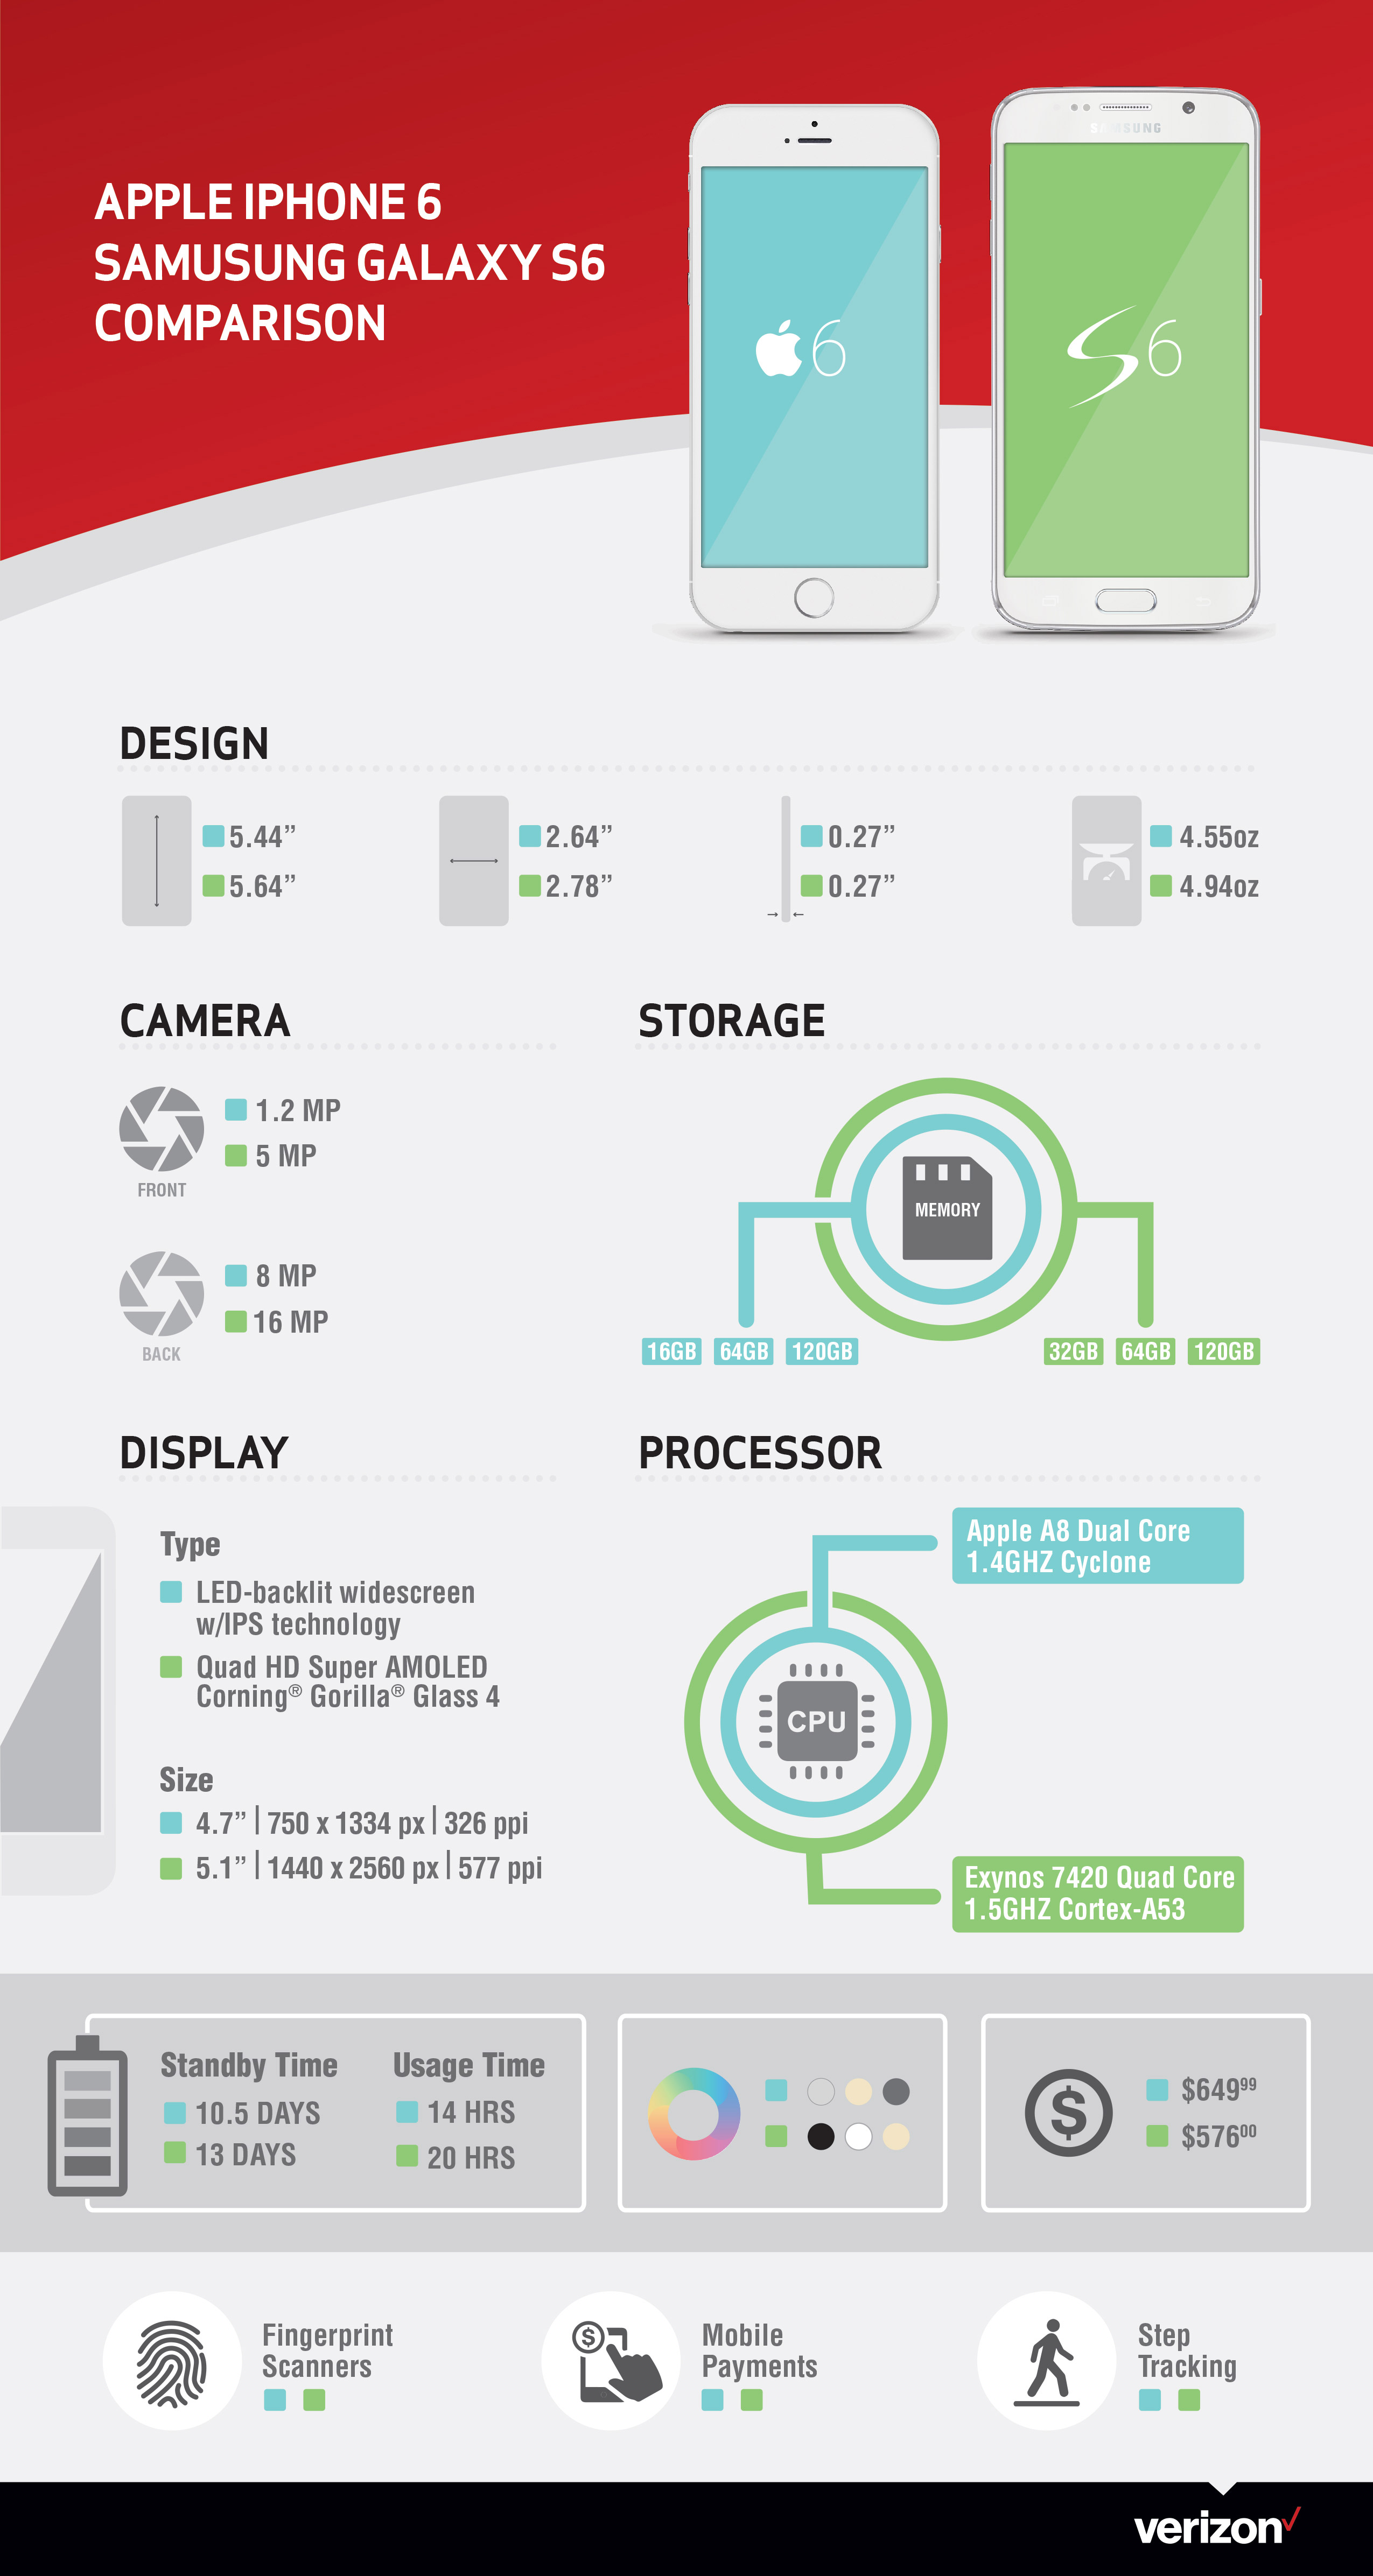
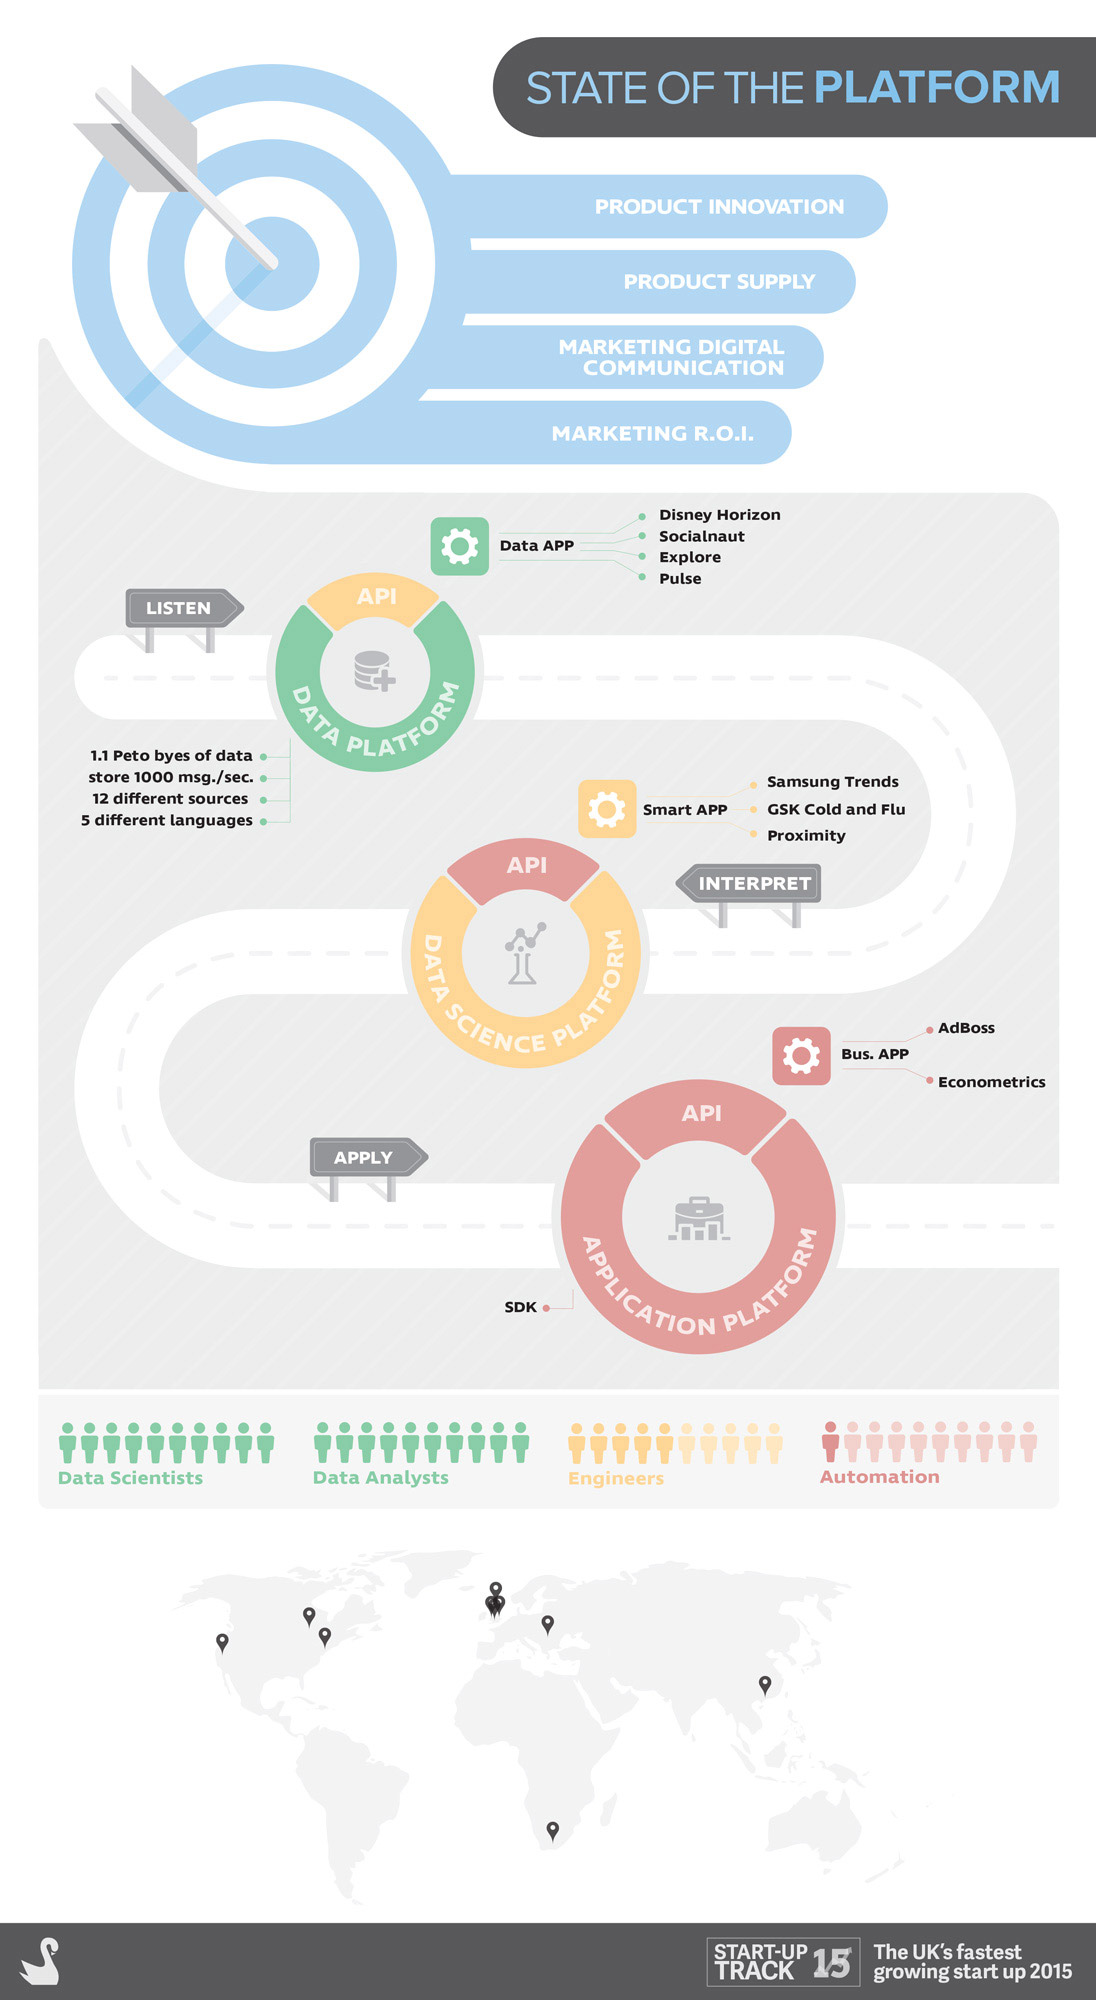
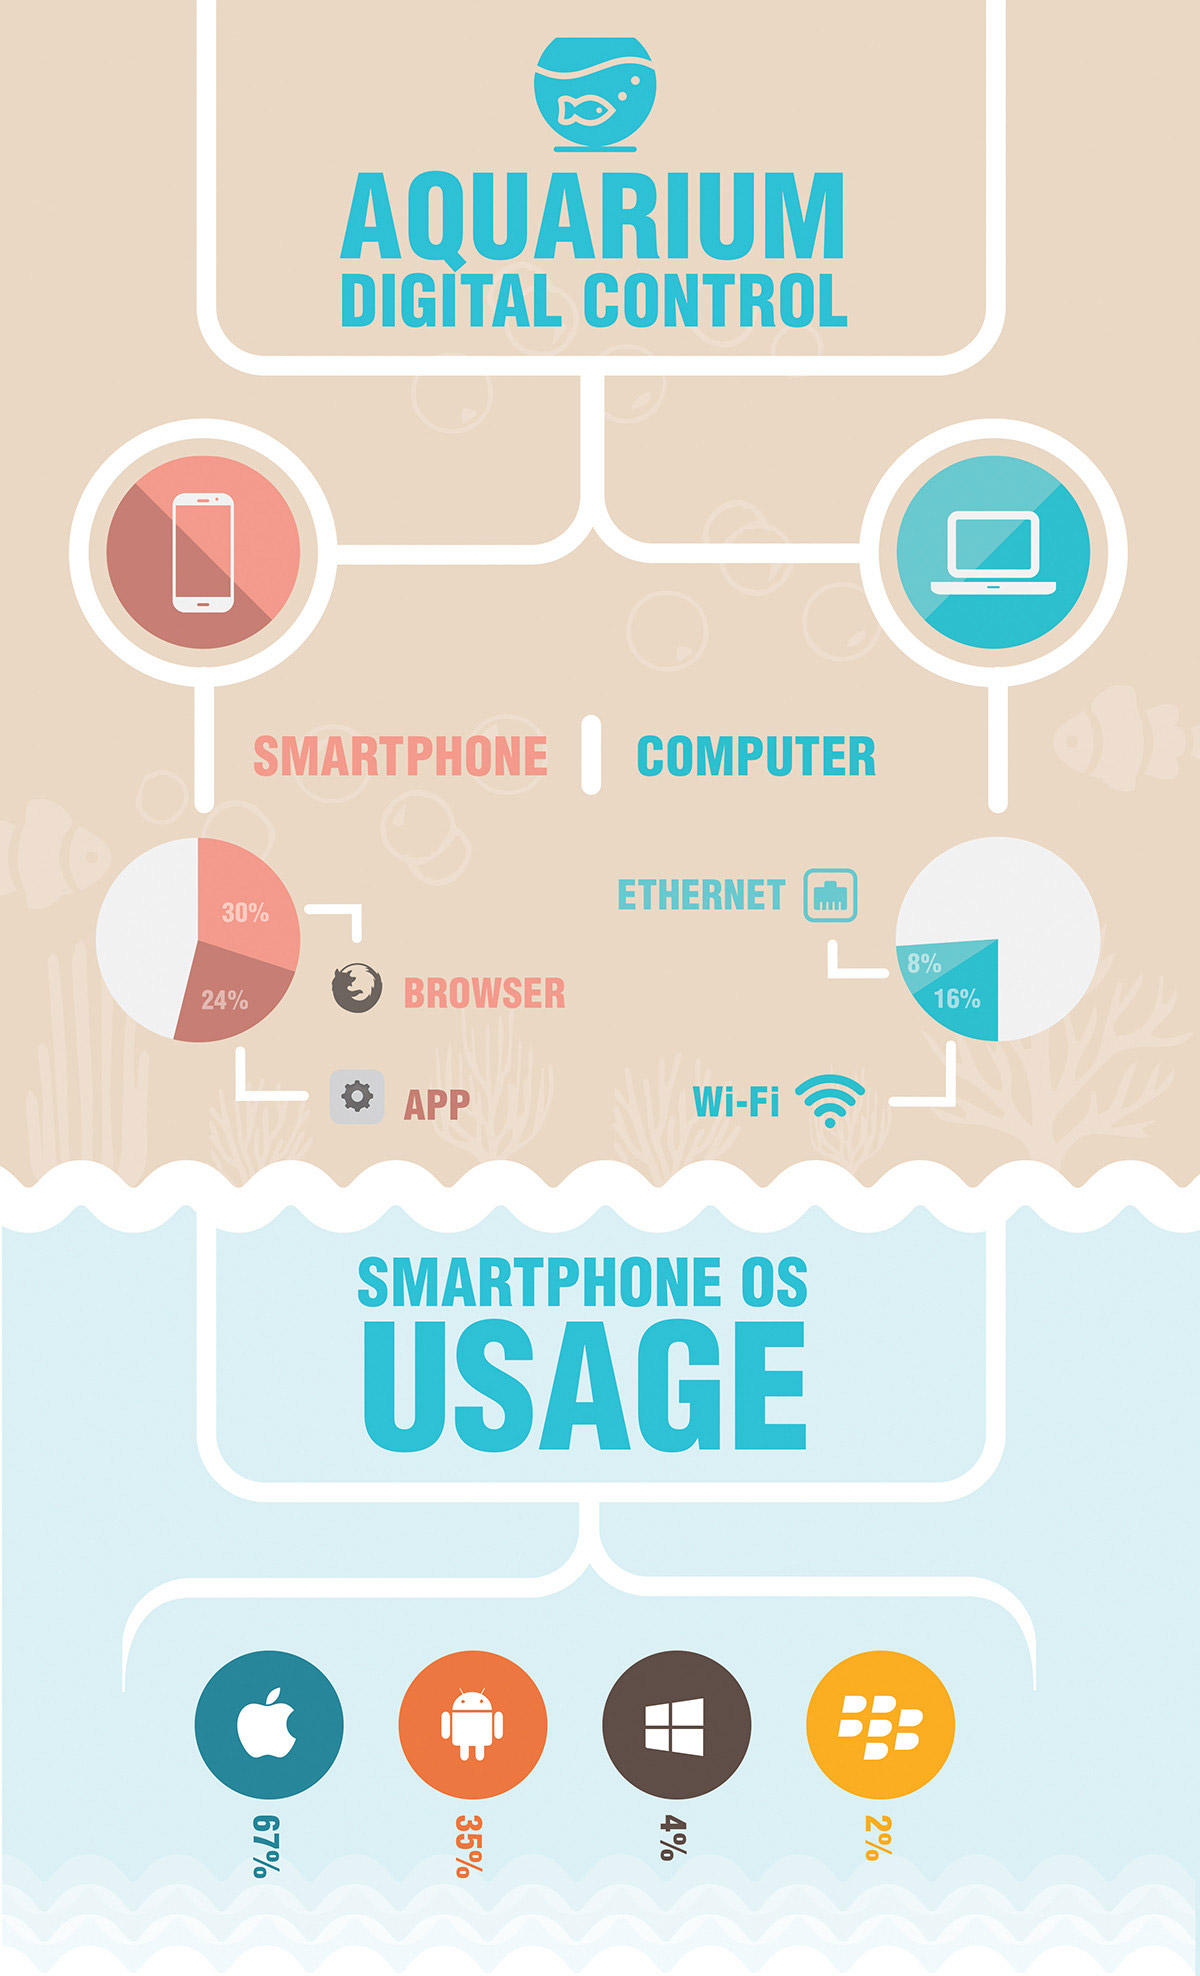
Visual representation of information in a graphic format designed to make the data easily understandable at a glance. People use infographics to quickly communicate a message, to simplify the presentation of large amounts of data, to see data patterns and relationships, and to monitor changes in variables over time.